
Monkey Business: Predicting Volatility In The Financial Markets (from 22.96% To 22.22% Error Reflections)
This post reflects work in progress, and ideas that are being tested/implemented at the moment. Meanwhile the competition has had a new best result (score below 20%).
---
The essence is feature engineering, as not all possible add-ons to the dataset have been explored yet. The main focus is on day-level measures and product-level measures (as now the data is “product-day”, it’s worth grouping it as many of other participants mention).

Features engineering
The features that I’m adding for day-level are:
-
N of unique days for the product (how many days the product is present on the market)
-
Min of market (minimum for the whole market for that day)
-
Max of market ( maximum for the whole market for that day)
-
Volatility of market (here a few possible ways to calculate; either mean of means or mean of ending/beginning volatilities for the day)
-
N of empty volatilities in the day (total)
-
N of empty returns in the day (total)
-
Average spread for the day (mean of differences between the beginning and ending value of volatilities for all the stocks on any given day)
-
Max spread for the day (the maximal difference between beginning and ending value of volatility on any given day)
-
Min spread for the day (the minimum difference between beginning and ending value of volatility on any given day)
-
Average first three volatilities for the market (for all the stocks of the day, mean of means for first three volatilities - opening)
-
Average of last six volatilities for the market (for all the stocks of the day, mean of means for last six volatilities - closing)
-
Other parameters related to up/down ticks, up/down vol. movements and their quantity (all average for the whole market for each day)
The features that I’m adding for product-level are:
-
N of unique products in a day (how many products are present in each day)
-
Minimum volatility for the product for all time (all days in the sample)
-
Maximum volatility for the product for all time (all days in the sample)
-
Average volatility for the product for all time (mean of means for volatilities for all time)
-
Number of total empty volatilities (how many empty values are there)
-
Number of total empty returns (how many returns are there)
-
Average spread for all days (mean of spreads for all days in the sample)
-
Minimal spread for product (all days)
-
Maximal spread for product (all days)
-
Average first three volatilities for the product (all days)
-
Average last six volatilities for the market (all days)
-
Other parameters related to up/down ticks, up/down vol. Movements and their quantity (all average for the product, for all days)
One other measure that could be used is correlation of volatility of market and volatility of the stock for every given day (but this one has not been added yet).
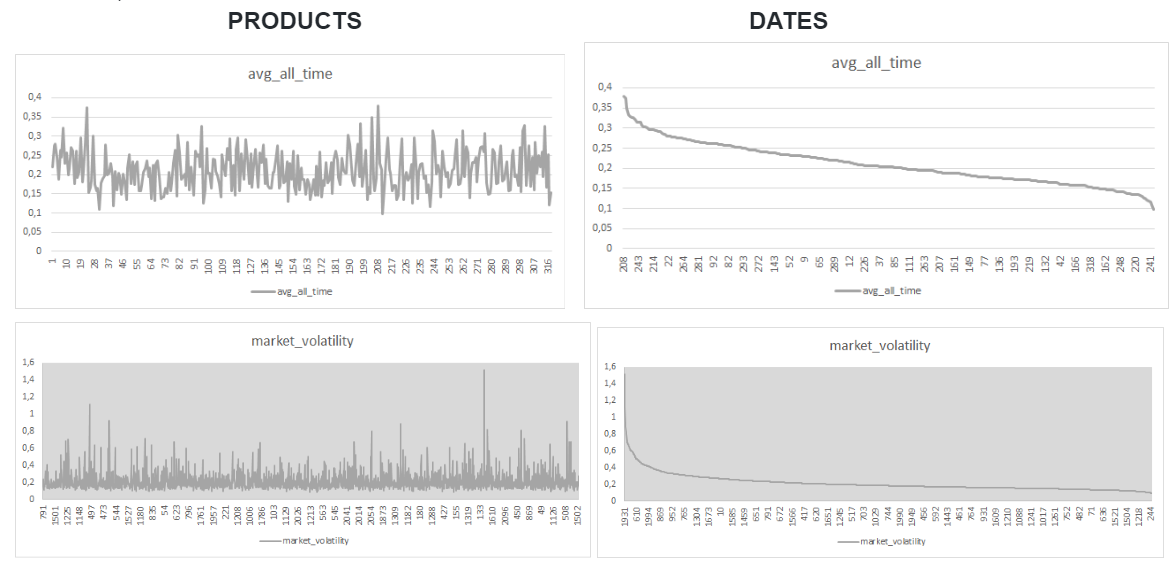
First look at distribution per date and per product (these are both representing the simplest average measures):
Layering
The model currently has layers:

Features importance and model results progress
Obviously, that is way too many variables to “throw at the model”. But we want to see the big picture first.
So, with “generated first” (with no returns included + this is the XGBoost model graph)
For “generated first” but with returns included, again for XGBoost (also clearly visible that overall model performance is worse):
For “generated second”, again XGBoost model (it’s improved somewhat, but still very much behind the weighted linear regression):
Well maybe it’s worth selecting just, say, 50 or 60 best parameters and seeing what happens? Even if it is just out of interest.
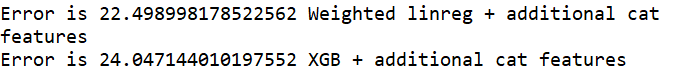
As visible below, when best 40 features or so are selected, the result of XGBoost is much more robust to it as result of linear regression. The change in the error level for weighted regression here is really noticeable.
Overall, it has been said many times and is visually apparent that what is happening in the beginning of trading day and at the “end” (13-55) is far more important that what goes on between the two in terms of this model. Also, the market/product indicators seem to have made quite a difference.
Further ideas (apart from implementing that correctly on test and submitting) are:


-
Groups of products (depending on their volatility, as their spreads are very different) - creating a categorical variable, possibly
-
Marking dates with volatility peaks (events on the market? As graph above demonstrates, there clearly are such dates)
-
Building a validation scheme in order to not have drastically different results on test and on train datasets
-
Finding the optimal combination of variables which to include
-
Tuning in the XGBoost or ensembling a few models together
-
The market/product correlation idea